For most in New Hampshire, COVID-19 death risk is less than that of driving. A responsible school opening strategy must allow most children to fully return to school, while also providing alternatives to satisfy student and staff families with legitimate health concerns and risk factors.
Stats that inform, scary hype that doesn’t
One of the challenges in making personal and policy decisions about COVID-19 risk is trying to sort through myriad articles and opinions published in media. Their quality and integrity vary greatly. Unfortunately, media is incentivized to scare and polarize us, because that creates more viewer engagement and corresponding advertising revenue. The debate on how schools should open is conflated by this emotional response.
As COVID-19 associated deaths have mostly declined these past months, reporting has focused on the number of “cases”, or emphasized hot spots in places like parts of Arizona. These are sometimes vacuous articles not even mentioning if those testing positive had any symptoms. Reporting often doesn’t acknowledge the substantial increase in tests taken nationwide: more tests will produce more positive results as well as more negative results. It is important to focus on hospitalizations and deaths, and to understand their most influential factors.
Another challenge is anchoring an amorphous risk to something we know. I choose driving. In New Hampshire in 2018, 147 people were killed in automobile accidents. Yet most of us have little concern about driving, doing it almost every day. We take some reasonable precautions, such as using a safety belt or a motorcycle helmet. We accept the very small risk of an accident or fatality because driving provides the benefit of quick travel to places of employment, education, shopping, and recreation. There is no zero-risk option.
As a concerned parent and Hooksett School Board member, I’ve dug more deeply into the NH COVID-19 data. I wanted to share this to help people challenge their perspectives, reduce anxiety, and facilitate a more informed conversation on school reopening.
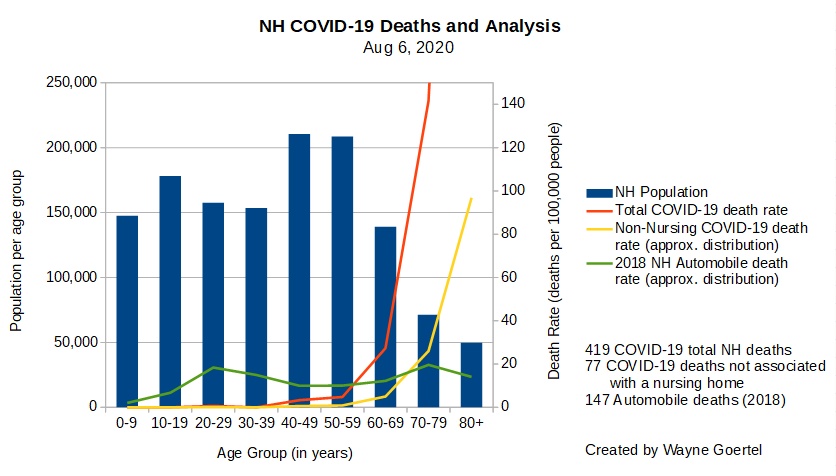
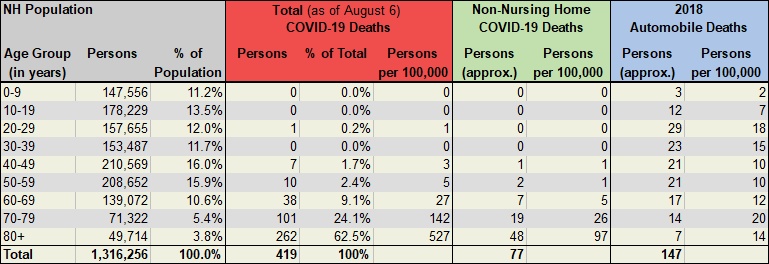
Nursing homes are associated with nearly half of deaths associated with COVID-19 nationally, but New Hampshire’s distribution is over 80%. Conversely, the state has a small portion of COVID-19 deaths beyond nursing homes. I compared these against automobile deaths by age group. Because the number of people in each age group varies, we calculate “deaths per 100,000 people” so we can compare death rates between differently sized age groups
Details for some age groups
NH residents of ages 0-9 totaled 147,556, or 11.2% of the population. There have been no COVID-19 associated deaths reported for this age group in NH. There were approximately 3 automobile deaths in 2018.
NH residents ages 10-19 totaled 178,229 people, also with no COVID-19 deaths. However, this group experienced approximately 12 automobile deaths.
These first two groups are particularly significant given New Hampshire daycare facilities were available to essential worker families during “lockdown”, expanded capacity in May, and camps opened in June. Credible research confirms younger people often have no or mild COVID-19 symptoms; most are tremendously resilient and surprisingly bad at transmitting COVID-19.
For NH residents of ages 60-69, 139,072 people, there have been 38 COVID-19 associated deaths. Approximately 7 of these were people not in a nursing home. For comparison, 17 people died in automobile accidents.
The 71,322 people of ages 70-79 are about half as many as those 60-69. Yet this group has seen 101 COVID-19 deaths, with approximately 19 outside a nursing home. Compare to 14 automobile deaths. The corresponding death rates per 100,000 are 142 for total COVID-19, 26 for non-nursing home COVID-19, and 20 for automobile. This group’s COVID-19 death rate is five times the 60-69 group’s (142 vs. 27 per 100,000 total, and 26 vs. 5 per 100,000 non-nursing home).
Unfortunately, people aged 80+ have experienced 62.5% of the COVID-19 fatalities, despite being the smallest group (49,714). Approximately 48 of those 262 deaths were for people outside a nursing home. Compare to 7 automobile deaths. The corresponding death rates per 100,000 are 527 for total COVID-19, 97 for non-nursing home COVID-19, and 14 for automobile.
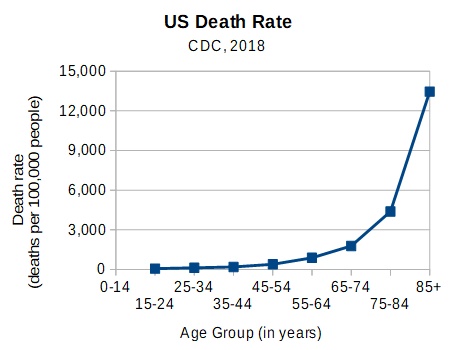
This distribution of total NH COVID-19 deaths per age group is very similar to previous years’ overall US death rates. People over 80 are much more likely to die of anything than those 70-79 or younger.
Research indicates significant COVID-19 fatality risk factors of age, organ transplant, hematologic malignancy, kidney disease, stroke or dementia, obesity, diabetes, non-hematologic cancer, liver disease, male gender, and others.
The bottom line
This is not meant to diminish the overall concern of COVID-19. My intent is to put it into perspective with other risks, to help focus concern and safety measures on those at greatest risk based on data – and not hysteria. The most vulnerable by a large margin are those in nursing homes or aged 80+.
For many student and staff families without significant risk factors, it appears that the COVID-19 fatality risk of being present in school may be less than the fatality risk of driving there. In NH, there are no deaths reported among people under 60 without comorbidities.
Instead of choosing “one size that fits few”
Speaking only for myself, I have no doubt that schools should implement customized versions of the fully present and remote models for back to school, concurrently. Imagine most of our classrooms operating five days/week with prudent safety precautions, and a remote-only option for those who wish to avoid school contact.
The “hybrid” model – half density in-person classes alternating with remote classes – was conceived to accommodate the older 6′ CDC distancing guidance. It has practically little upside compared to being fully remote.
Finally, SDGANH highlights numerous other options which exist for families who desire something else.
Nobody can make your back-to-school decision for you, but I hope this article and research makes that decision easier.
-Wayne
Article updated August 6, 2020 with more recent NH COVID-19 data and minor edits.
Links:
NH covid-19-update 07.13.2020
NH covid-19-update 08.06.2020
IIHS fatality-statistics state-by-state
NHTSA Publication 812928
NHTSA Publication 812806
NH OSI data-center census
CDC databriefs db355-h
Acronyms:
DHHS = Department of Health and Human Services
OSI = Office of Strategic Initiatives
NHSTA = National Highway Transportation Safety Administration
SARS-CoV-2 = Severe Acute Respiratory Syndrome Coronavirus 2
COVID-19 = Coronavirus Disease 2019 pandemic
Methodology:
Due to shortcomings in the source data, the distributions of the non-nursing home COVID-19 and automobile deaths over age groups are approximated. For the NH distribution of automobile deaths, I applied a distribution of national data from the National Highway Transportation Safety Administration. For the distribution of non-nursing home COVID-19 deaths, I simply multiplied total deaths for each age group by the overall comparative factor 18.4% (77/419).
Understandably, the data will change somewhat as the rest of 2020 progresses. But with over half the year complete, the themes will remain valid.